Overview
3.D. — Drone Damage Detection is a computational tool developed as part of the CORE course at TU Delft, together with Raymen Borst and Nils Wulfsen. The project addresses one of the critical bottlenecks in post-earthquake recovery: rapidly assessing the structural condition of entire building stocks in unsafe areas, without putting people at risk.
Following the February 2023 earthquakes in Turkey — which destroyed or damaged an unprecedented number of buildings — satellite imagery proved insufficient. Top-down satellite views can show whether a roof is missing, but cannot reveal façade damage, structural cracks, or whether a building is actually habitable. The project's response was to harness something increasingly available: consumer drones.
The Problem
Existing post-earthquake assessment methods have three major shortcomings:
- Satellite images only show roof condition — not façade or structural damage
- Creating damage maps manually takes months or even years
- No per-building classification exists that supports renovation vs. demolition decisions
The project posed a direct research question: How can a computational tool detect the damage of post-earthquake buildings using pictures taken by consumer drones?
Why Drones
Consumer drones offer what satellites cannot. With centimeter-level resolution, oblique 360-degree views, and embedded GPS metadata, they can document all sides of a building in detail. As drone ownership continues to grow every year, any person near a disaster zone becomes a potential data contributor. Unlike news footage — which suffers from wrong angles, low pixel density, and no GPS — a deliberate drone orbit around a building yields the comprehensive, geolocated visual material needed for damage analysis.
Damage Classification System
To classify buildings consistently, the project adapted the European Macroseismic Scale (EMS-98) into four categories:
- Intact — Negligible to slight damage; hairline cracks only; nearly all windows and doors untouched
- Damaged — Moderate structural damage; cracks in many walls; failure of individual non-structural elements
- Severely Damaged — Heavy structural damage; serious failure of walls; partial failure of roofs and floors
- Collapsed — Very heavy structural damage; partial or near total collapse
Buildings in categories 1–2 are candidates for renovation; categories 3–4 require demolition.
Three Damage Analysis Methods
Three parallel approaches were developed and tested against the same proof-of-concept building — a vacant office building near Delft Campus station, chosen precisely because it showed minor cracks, missing windows, and partial façade damage:
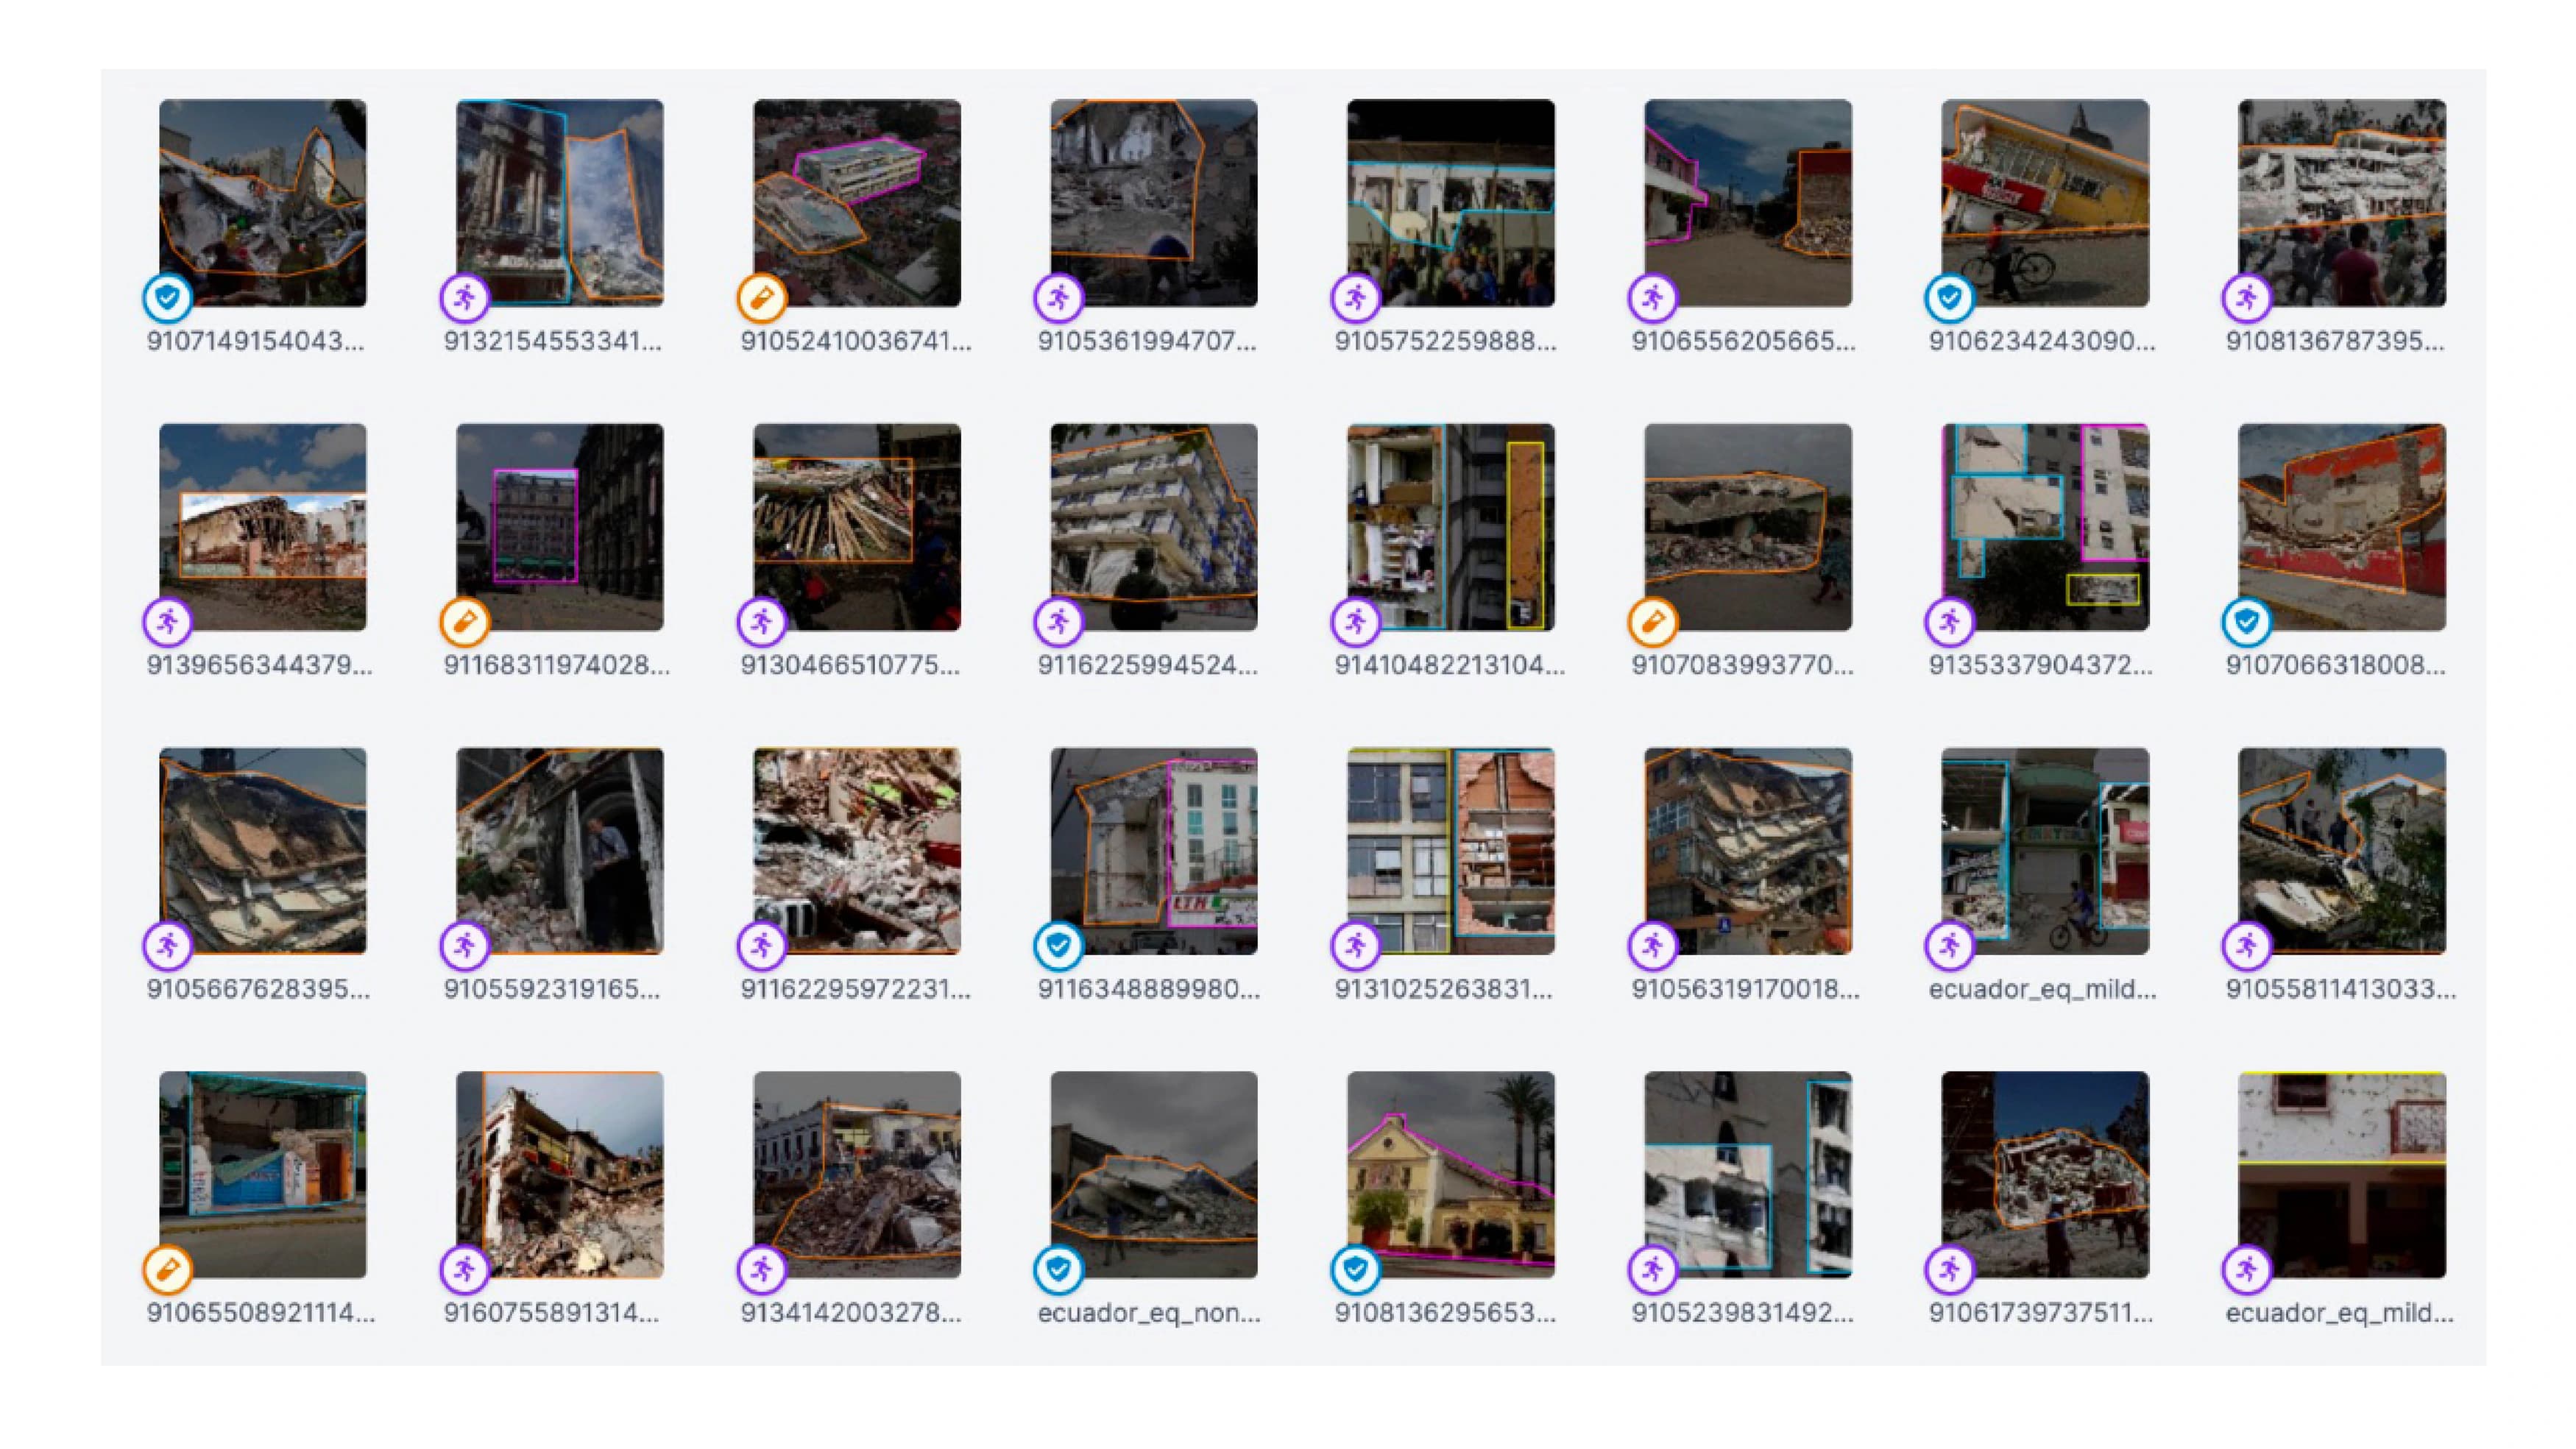
1. Correlation (YOLOv8) A custom dataset of approximately 350 annotated images across the four damage categories was built in Roboflow, then used to train a YOLOv8 object detection model in Google Colab on an Nvidia Tesla T4 GPU. The trained model reliably detected and categorized buildings in both the proof-of-concept footage and YouTube drone clips from the Turkey earthquake. Validation accuracy reached 93.2% mAP50 across all classes. The recommended path forward is scaling the database to ~25,000 images per category for production use.
2. 3D Point Cloud Model Using the drone footage frame-by-frame, a photorealistic 3D point cloud model was generated in Reality Capture with millimeter-level precision. Reference surfaces were plotted across each building façade; wherever the 3D model penetrated those surfaces, an anomaly was flagged. The greater the penetration, the higher the damage classification. While technically compelling, exporting the model from the proprietary software hit a paywall, so the damage overlay was demonstrated manually in video form.
3. Crack Detection A crack detection model was trained using over 3,000 pre-annotated images from Roboflow. It successfully identified cracks and spalls on the proof-of-concept building. The current limitation is that it cannot yet differentiate between crack types (alligator, longitudinal, transverse), which prevents precise structural classification — but it shows strong potential as a complementary layer to the correlation approach.
GPS Mapping and Priority System
Each drone photo carries embedded EXIF GPS data. A Python script extracts latitude and longitude from this metadata, then uses OSMnx to pull building footprints from OpenStreetMap for that location. The damage classification output from the YOLO model is filtered for the four status keywords and mapped to a color:
- Green → Intact
- Yellow → Damaged
- Orange → Severely Damaged
- Red → Collapsed
Buildings with no data remain gray. For video input, the most frequent classification across all frames determines the final color assigned to that building on the map.
On top of the damage map, a priority system assigns scanning urgency based on building type — hospitals, schools, train stations, apartments, and civic infrastructure score highest, while warehouses and garages score lowest. This helps drone operators in the field decide which buildings to scan first.
Real-Life Application
The envisioned deployment scenario is a mobile app called Drone Damage Detection (3.D.). When an earthquake strikes, everyone in the affected area receives an SMS with a download link. Drone owners open the app, select a building on the live map, fly their drone around it in a 360-degree orbit, and upload the footage directly. The system processes the video, classifies the building, and immediately updates the shared map — so all participants see in real time which buildings have been assessed and which still need coverage.
Reflection
The correlation model and GPS mapping pipeline represent the most successful outcomes of the project. The YOLOv8 approach proved that building damage classification from oblique drone imagery is feasible with a modest training dataset, and the map integration demonstrated that per-building status can be derived automatically from drone footage and pushed to a spatial interface.
The 3D model approach showed genuine promise for millimeter-precision analysis but was constrained by software licensing. Crack detection works reliably at the object level but needs a more structured database to support fine-grained structural classification.
The broader ambition, a crowdsourced, drone-powered damage map that updates in real time after a disaster, is technically within reach. The project establishes the core pipeline from footage to classification to map, and demonstrates a proof of concept in Delft that, with a larger training dataset, would translate directly to any earthquake-affected city in the world.